|
About Us The five bodies in the header bar all have contributed to identifying aspects of the engineering problem described on this page and to arriving at the proposed solution it outlines. The overall problem - that at present no one knows enough about how aircraft wake vortices behave in various conditions - has significant consequences. Its solution should lead to safer air travel and to improved use of airport resources. The acoustic-imaging proposal presented here combines proven commercial off-the-shelf (COTS) technology with expertise in applying relevant algorithms provided by Bob Dougherty of OptiNav and with system integration by Microstar Laboratories under subcontract to Titan. Titan ordered the initial tests of this system at the request of Volpe - a division of the DOT - and NASA. NASA and the US Dept. of Transportation are exploring several research sensors for measuring wake vortices. See "Other Sensors". |
|
Further reading |
|
Other Sensors LIDARS (CW and Pulsed) Windline (Anemometer Array) Vortex SODAR Vortex RASS RADARS (C-Band and FMCW) Passive Acoustics (Mic Array and Opto-Acoustical Sensors) |
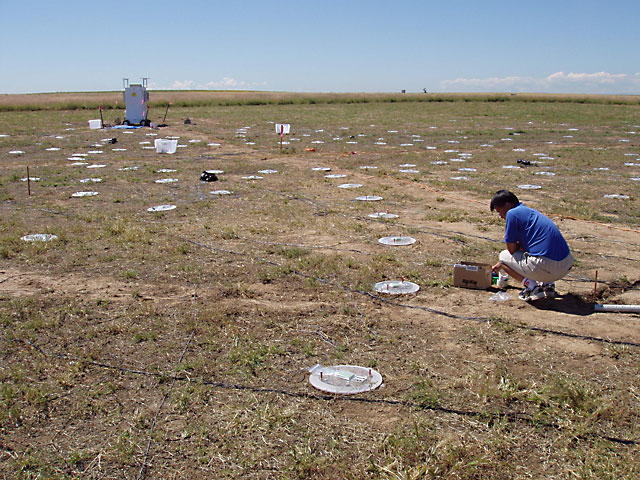 The microphones, mounted on plastic ground planes, formed an interleaved spiral of four groups of microphones. |
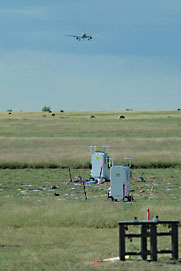 Two of the four environmental enclosures housing the distributed data acquisition system |
Wake Vortices
In flight, an aircraft creates a pair of counter-rotating vortices, spinning off each wing tip and extending back along the flight path in the sky. The strength of the vortices varies directly with the weight of the aircraft for any given airspeed. Wake vortices present a hazard to following aircraft, especially to lighter following aircraft, because a vortex can cause an uncommanded roll if an aircraft flies along it.
Pilots usually cannot see wake vortices, so in practice they avoid them by assuming their presence and by staying far enough away from them to allow time for the vortices to migrate out of the way or to dissipate. Current aircraft separation requirements place an important limit on airport capacity. An improved understanding of vortex dynamics may lead to increased capacity while preserving safety.
Although wake vortices usually leave no visible trail, they leave an acoustic trail. A recently completed field trial at Denver International Airport demonstrated a technology for mapping wake vortices using a large number of microphones, high-performance data acquisition hardware, and beamforming software: an aeroacoustic phased array.
Aeroacoustic Phased Arrays
A group of transducers with relative time - or phase - shifts between the elements forms a phased array. The combined elements act as a single sensor that can focus on distinct points in space. Various arrays transmit and receive electromagnetic and acoustic waves according to the requirements of particular applications: radar and sonar, for example. Aeroacoustic test applications have used phased arrays of microphones to measure the acoustic source distributions of jets and wind-tunnel models of aircraft.
An aeroacoustic phased array has three key parts: microphones, a data acquisition system, and beamforming software. During the test condition, the system acquires and records to disk the microphone-pressure time histories. Key characteristics of the data acquisition system include synchronization, gain control, dynamic range, data rate, antialias filtering, storage capacity, and data management. In post-processing, the beamforming software combines the signals with differing time or phase shifts to produce a map of the source distribution.
The beamforming software and the array layout must take into account the physics of sound generation and propagation. In particular, wake vortices produce frequencies in the range of 5Hz and this implies wavelengths of around 68 meters (223 ft). With aircraft as close as 700 ft overhead, it takes many precisely positioned microphones to construct an unambiguous map of the sound source.
The OptiNav/Titan/Microstar Laboratories/ACB Array
The test system combined signals from 252 Panasonic electret microphones, distributed over a 31 x 122 m area on the ground. The first full deployment took place in September 2003, at a spot about a mile from the threshold of runway 16L at Denver International Airport. The microphones, mounted on plastic ground planes (supplied by Modelwerks) with custom Microstar Laboratories printed circuit boards, formed an interleaved spiral of four groups of microphones.
Four environmental enclosures housed a distributed data acquisition system. Each enclosure collected signals from up to 64 microphones (see photo, left) using two 32-channel ACB COND32.A preamps and 8 Microstar Laboratories iDSC 1816 data acquisition boards. An industrial dual-processor PC in each enclosure provided two independent PCs that each hosted four boards. Microstar Laboratories MSXB 045 clock boards synchronized the eight data acquisition boards in each enclosure to nanosecond precision.
The total system had the capacity to record 9.6 million samples per second continuously. A separate PC with several removable hard drives provided archival storage. By the end of the three-week test, the acquired data totaled about 2 terabytes.
In addition to existing and custom hardware, Microstar Laboratories performed all system integration, including custom software for the graphic user interface, data backup, and integration with other data sources, such as GPS time. OptiNav provided the array design, the beamforming software, acoustic data analysis, and a camera system for airplane tracking. Both companies provided on-site test support.
Goals for the Denver test included making 3D images of the aircraft wakes as a function of time and a wide range of frequency. Statistical measures of the acoustic wake strength, correlated with aircraft type and configuration and weather conditions, will determine the reliability of this technique for wake vortex measurements.
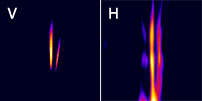
The above shows images from the Denver test, in the Vertical and Horizontal planes. Click on the image to see a 32 second AVI file of the plane followed by its wake (141 kB). Or right-click and save it to your PC for easier viewing. The colors indicate the strength of the sound source.
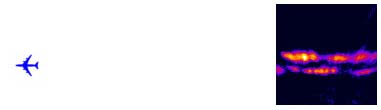
A preliminary test generated the following acoustic image of the wake generated by a Boeing 747 approaching SeaTac Airport. The image was produced using a 64-microphone subarray of the system in a checkout test and clearly shows the passage of the plane and wake. Click on the image to see a 35 second AVI file of the plane followed by its wake (364 kB). Or right-click and save it to your PC for easier viewing.
Contact us for more information.
 In flight, an aircraft creates a pair of counter-rotating vortices, spinning off each wingtip and extending back along the flight path in the sky. |
|
Centers of Related Research Institute of Sound and Vibration, Southampton University NASA-Ames NASA-Langley NASA-Glenn Boeing ONERA NLR |
 Sample ray paths from a point on a model to microphones in a phased array located outside of an open jet. |
|
Pioneers The use of aeroacoustic phased arrays for real aircraft in flight was pioneered by Ulf Michel at the German Research Laboratory (DLR). He and his colleagues started with a linear array on the ground under the flight path of a jet fighter. They progressed to planar arrays on the ground that are similar in layout to arrays developed by Boeing for wind tunnel testing. They have made acoustic source images of many types of commercial aircraft on landing and takeoff. In recent years, DLR has extended the flyover technique to mapping the sound produced by aircraft wake vortices. |
 Inside one of the environmental enclosures |